Global e-waste produced since you opened this page:
{{ waste.toLocaleString('en-US',{ minimumFractionDigits: 0, maximumFractionDigits: 1 }) }} tonnes
World map

Our Planet vs.
E-waste

Visualising the true scale of the world’s e-waste problem
Landfill full of eleectronic waste

Based on figures from the 2020 Global E-Waste Monitor Report, we have taken the amount of e-waste reported generated in 2019 to estimate that in a single month, the world generates approximately 4.5 million metric tonnes of e-waste, of which only 17.4% is documented as formally collected and recycled.

The report defines e-waste as discarded electronic products with a battery or plug, such as computers and mobile phones. The amount of e-waste generated globally continues to rise year on year (YoY) and is in fact, increasing at a rate three times faster than the world’s population.

And the extent of the problem is catastrophic to the environment.

If sent to landfills, e-waste can leak harmful chemicals into the soil, or if incinerated, fumes release chemicals into the air, contributing to global warming. Not only this, but everything from our phones to our laptops rely heavily on precious materials to operate, which are limited resources that directly impact climate change when extracted from the earth.

musicMagpie and its US brand, Decluttr have visualised the monthly generation of e-waste worldwide to demonstrate the true scale of the problem and highlight the need for a change in behaviour in the way that we buy, use and recycle our tech.

Estimated Monthly E-Waste Generated Around The World

Click on a country within the map to discover the total e-waste we have estimated it generates in a single month and how this equates to the weight of their iconic landmark. You will also uncover how much e-waste is generated annually per person.

{{ world_data[world_selected].country }}
E-waste produced by the country per month
{{ format(world_data[world_selected].monthly) }}tonnes
E-waste produced by the country per month is equivalent in weight to…
{{ world_data[world_selected].filled }}{{ world_data[world_selected].label }}
E-waste produced per person, per year
{{ world_data[world_selected].capita }} kg

*Not all countries include a reference to a landmark due to information on the weight being unavailable.

UK Focus

Click on a landmark to uncover how its weight compares to the estimated monthly e-waste generated by the UK.

{{ uk_data[pin].name }}
Weight of the landmark:
{{ format(uk_data[pin].weight) }}tonnes
The weight of the landmark is equivalent to just
{{ uk_data[pin].monthly }}of the monthly e-waste produced by the UK
Weighing the equivalent to
{{ format(uk_data[pin].numfilled) }}
{{ uk_data[pin].label }}
*Landmark weights are based on editorial desk research. Numbers are estimates only.
Monthly e-waste produced in the UK is equivalent to 51 Blackpool Towers
Blackpool Tower
The Blackpool Tower weighs 2,586 tonnes
Monthly e-waste produced in the UK is equivalent to 89 Clifton Suspension Bridges
Clifton Suspension Bridge
The Clifton Suspension Bridge weighs 1,500 tonnes
Monthly e-waste produced in the UK is equivalent to 11 Shards
The Shard
The Shard weighs 12,500 tonnes
Monthly e-waste produced in the UK is equivalent to 53 Stonehenges
Stonehenge
The Stonehenge weighs 2,500 tonnes

The 10 countries generating the most e-waste per-capita

Understanding how much e-waste is generated per capita certainly paints a different picture of the amount of e-waste generated by an entire country.

In a single year, it is reported that per capita, Norwegians are generating 26kg of e-waste, followed closely by people in the UK and Switzerland, where they generate approximately 23-24kg of e-waste.

These figures far exceed the world’s per capita average of 7.3kg and the European average of 16.2kg.

1.
Norway
26.0
kg
2.
UK
23.9
kg
3.
Switzerland
23.4
kg
4.
Denmark
22.4
kg
5.
Australia
21.7
kg
6.
Netherlands
21.6
kg
7.
Iceland
21.4
kg
8.
United States
21.0
kg
9.
France
21.0
kg
10.
Belgium
20.4
kg

The 10 countries generating the largest amount of e-waste monthly

Country
Monthly e-waste (tonnes)
1
China
844,121
2
USA
576,500
3
India
269,152
4
Japan
214,080
5
Brazil
178,550
6
Russia
135,930
7
Indonesia
134,831
8
Germany
133,892
9
United Kingdom
133,141
10
France
113,538

Yearly E-waste Generated Over Time

Between 2015 and 2019, the e-waste generated by the world has increased by 21% and continues to rise at an alarming rate.

Fueled by factors such as digitisation, products with short replacement cycles and few options for repair, if we continue on this trajectory, by 2030, the world could be generating approximately 35% more than it is currently.

Consumer perceptions of e-waste

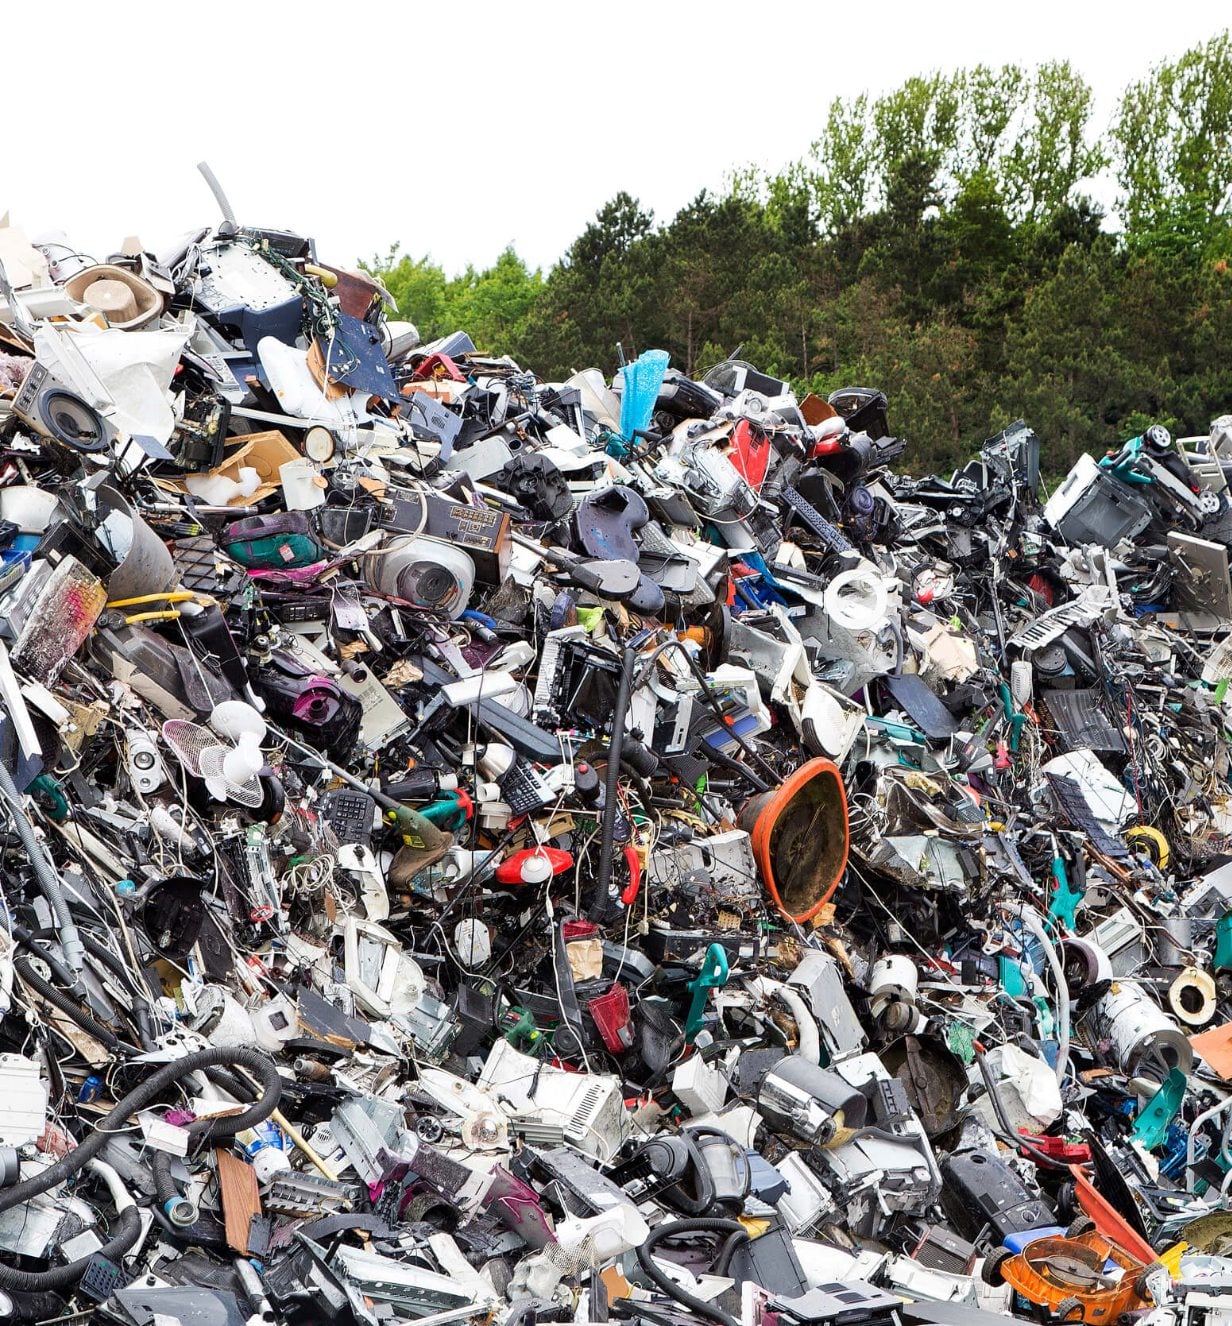
Despite this growing environmental issue, our research at musicMagpie* has found that an alarming four in five (79%) Brits do not know what e-waste is. When given the definition of e-waste, nearly a third (31%) didn’t believe it damaged the environment or were unsure, while 45% weren’t aware it impacted climate change.

Over half of Brits (54%) also admit to being surprised by the amount of e-waste the UK produces per year, with it being more than they expected.

Unless urgent action is taken, the issue of e-waste could worsen, as our research revealed that Brits are already sitting on £16.5 Billion worth of technology they no longer use, holding on average 11 unused devices per household**.

And almost half of Brits (47%) currently do not recycle, resell, or donate their old tech to charity, with most opting to hold onto it instead where it ends up at the back of drawers collecting dust. Staggeringly, almost five million adults*** even openly admit to throwing old tech in the bin at home.

E-WASTE VS THE ENVIRONMENT

Tap on the before/after buttons below each image to compare the world's estimated monthly e-waste production with environmental areas most at risk.

Click on the before/after buttons in the top right corner of each image to compare the world's estimated monthly e-waste production with environmental areas most at risk.

The planet produces enough e-waste in a single month to cover the Great Barrier Reef 57 times
The Great Barrier Reef before
The Great Barrier Reef after
Great Barrier Reef Area: 358,700 km²
The planet produces enough e-waste in a single month to cover the Antarctic 1.4 times
Antarctica before
Antarctica after
Antarctic Area: 14,200,000 km²
The planet produces enough e-waste in a single month to cover the Amazon Rainforest almost 4 times
Amazon rainforest before
Amazon rainforest after
Amazon Rainforest Area: 5,500,000 km²

The Small Changes You Can Make

1.
Don’t leave unused tech in the back of a drawer collecting dust
2.
Trade in your unused tech
3.
Responsibly recycle your unused tech
4.
Consider buying refurbished tech instead of new
5.
Repair broken electricals if you can
Recycle
re-use
reduce

Taking a Stand Against E-waste

This campaign is part of a wider educational initiative by musicMagpie and its US brand, Decluttr, which aims to raise awareness around the issue of e-waste and encourage consumers and leaders to take action.

We recently made a statement at the G7 summit where global leaders met to address the world’s most pressing issues. Mount Recyclemore is a giant sculpture of the G7 leaders’ heads made entirely of discarded electronics which we erected on Sandy Acres beach overlooking Carbis Bay where the summit took place. Mount Recyclemore initiated a global conversation that spread across all four corners of the Earth.

In a year, we give nearly half a million consumer tech items a ‘second life’. We refurbish 95% of the products we receive from our customers, and if we can’t refurbish them, the majority of their parts will be reused to refurbish other products.

A great way to reduce global e-waste is through mobile recycling. By visiting our sell my phone page, you can sell iPhones, Samsung phones & more. We also recycle other e-waste products including iPads, consoles and laptops.

You can also buy refurbished phones. This is a great way to buy iPhones but in an environmentally responsible way.

Methodology & sources

For this piece, e-waste data was taken entirely from the following: Forti V., Baldé C.P., Kuehr R., Bel G. The Global E-waste Monitor 2020: Quantities, flows and the circular economy potential. United Nations University (UNU)/United Nations Institute for Training and Research (UNITAR) – co-hosted SCYCLE Programme, International Telecommunication Union (ITU) & International Solid Waste Association (ISWA), Bonn/Geneva/Rotterdam. The data covers the date range 2015-19.

The data specified above was subject to further analysis.

Data provided in the Global Monitor report was collected annually. For the purposes of the study, and to aid in visualising e-waste amounts, the annual amount of e-waste generated by a country was divided by 12 to estimate a monthly average – actual monthly e-waste generation may vary.

*The research was commissioned by musicMagpie, through Opinium in a nationally representative survey of 2,000 UK adults in May 2021.

**The research was commissioned by musicMagpie, through One Poll in a nationally representative survey of 2,000 UK adults in May 2020

*** 9% of UK adults tend to throw their old tech into their general waste or recycling bins at home. (52,673,000 x 0.09 = 4,746,039)

npd.com/wps/portal/npd/us/blog/2018/big-screens-big-data-the-future-for-smartphones/

thenextweb.com/plugged/2020/08/20/weight-most-popular-phones-of-2019-chart-apple-samsung-analysis

globalewaste.org